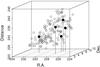
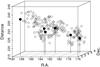
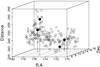
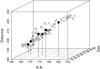
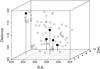
Fig. C.2
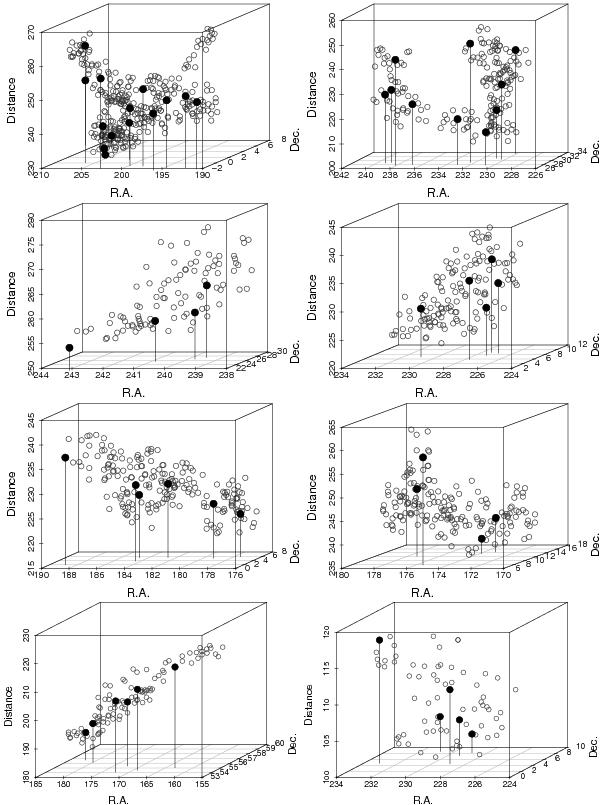
3D figures of the very rich superclusters described in Sect. 4.3. Filled circles show the location of rich groups and clusters with at least 30 member galaxies, empty circles show poorer groups. We plot the right ascension (in degrees), declination (in degrees), and distance (in Mpc/h) of groups. Plots of superclusters are given in the same order as they are presented in the text. From top to bottom: left: the supercluster SCl 061, right: SCl 094, left: the supercluster SCl 001, right: SCl 011, left: the supercluster SCl 024, right: SCl 055, left: the supercluster SCl 336, right: SCl 350.
Current usage metrics show cumulative count of Article Views (full-text article views including HTML views, PDF and ePub downloads, according to the available data) and Abstracts Views on Vision4Press platform.
Data correspond to usage on the plateform after 2015. The current usage metrics is available 48-96 hours after online publication and is updated daily on week days.
Initial download of the metrics may take a while.