Fig. 10
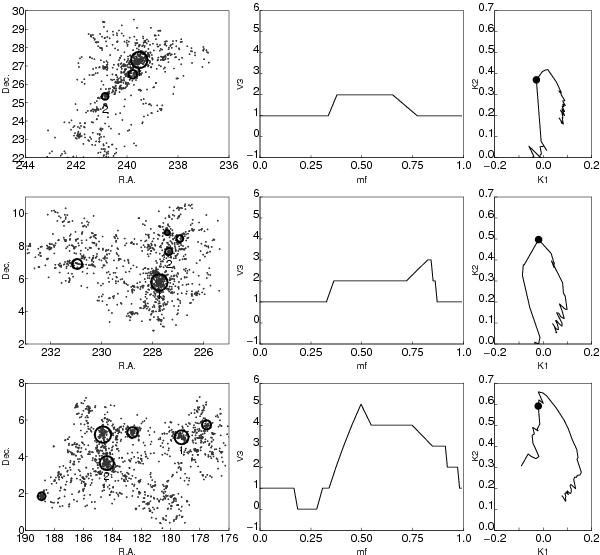
Panels as in Fig. 9. Filled circles in the right panel mark the value of the mass fraction mf = 0.7. Upper row: the supercluster SCl 001. The Abell clusters are 1 – A2142 and 2 – A2149. Middle row: the supercluster SCl 011. The Abell clusters are 1–A2040 and 2–A2028. Lower row: the supercluster SCl 024. The Abell clusters are 1–A1424 and 2–A1516.
Current usage metrics show cumulative count of Article Views (full-text article views including HTML views, PDF and ePub downloads, according to the available data) and Abstracts Views on Vision4Press platform.
Data correspond to usage on the plateform after 2015. The current usage metrics is available 48-96 hours after online publication and is updated daily on week days.
Initial download of the metrics may take a while.