Free Access
Fig. 3
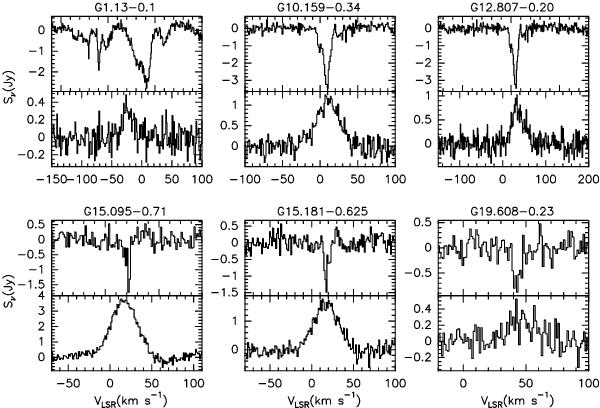
Spectra of H2CO absorption lines (upper panel) and H110α RRLs (lower panel) observed toward 23 H ii regions. The source name is given at the top of each panel.
Current usage metrics show cumulative count of Article Views (full-text article views including HTML views, PDF and ePub downloads, according to the available data) and Abstracts Views on Vision4Press platform.
Data correspond to usage on the plateform after 2015. The current usage metrics is available 48-96 hours after online publication and is updated daily on week days.
Initial download of the metrics may take a while.