Fig. 9
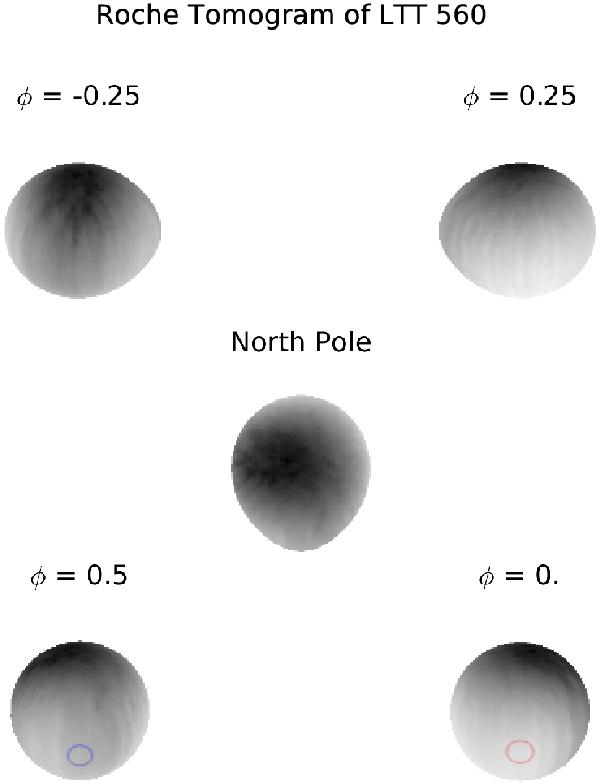
The surface brightness distribution of the secondary star of LTT 560 as derived from the Roche tomography. The L1 face of the star is seen at phase 0.5. The circles mark a region around L1 (lower left plot: seen from the front side; lower right plot: seen through the star). Dark regions represent diminished absorption features of the line profiles, interpreted as spotted regions.
Current usage metrics show cumulative count of Article Views (full-text article views including HTML views, PDF and ePub downloads, according to the available data) and Abstracts Views on Vision4Press platform.
Data correspond to usage on the plateform after 2015. The current usage metrics is available 48-96 hours after online publication and is updated daily on week days.
Initial download of the metrics may take a while.