Fig. 8
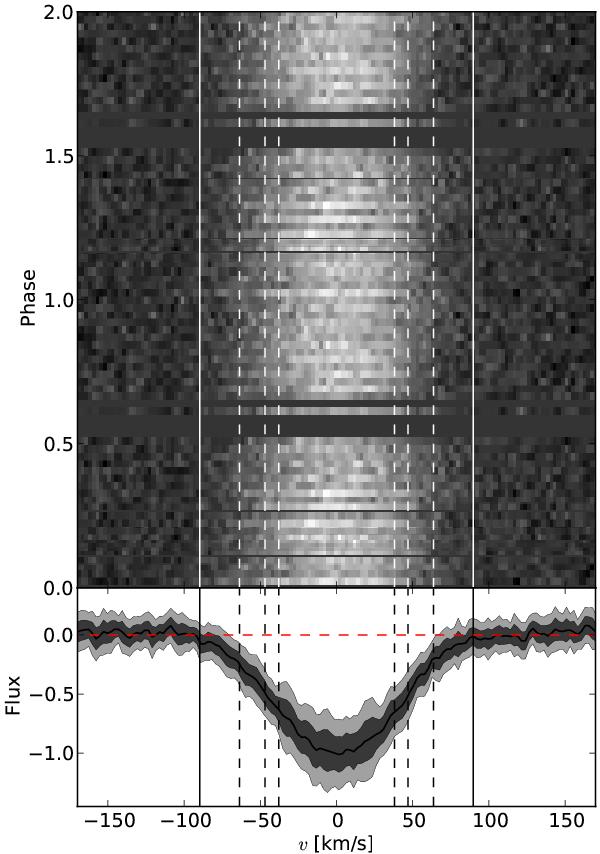
Radial velocity-corrected trailed spectrum (top) and the combined absorption line (bottom) resulting from the least square deconvolution for the data before the zenith break. Dark and light grey regions on the average line profile at the bottom panel show the 1-σ and 2-σ of the standard deviation throughout the orbit, respectively. Solid vertical lines depict the maximum allowed radius for the secondary star (i.e., its Roche-lobe radius RL1). The vertical dashed lines mark the estimated radius RMS (central lines) and the corresponding 1-σ confidence levels obtained from the RT by the χ2 landscape technique.
Current usage metrics show cumulative count of Article Views (full-text article views including HTML views, PDF and ePub downloads, according to the available data) and Abstracts Views on Vision4Press platform.
Data correspond to usage on the plateform after 2015. The current usage metrics is available 48-96 hours after online publication and is updated daily on week days.
Initial download of the metrics may take a while.