Fig. 2
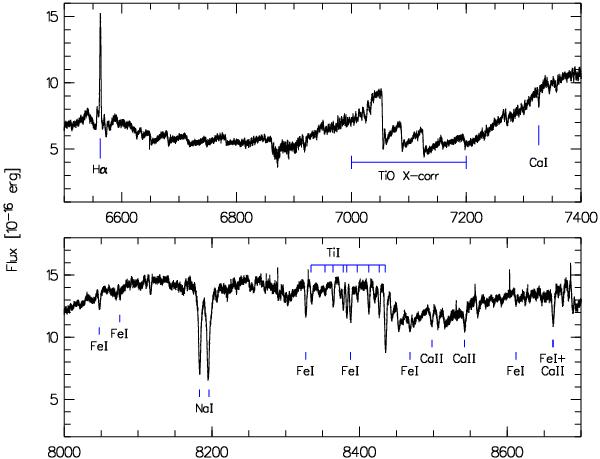
Selected ranges of the average red spectra. The respective individual spectra have been corrected for the radial velocities of the secondary star. The spectra are not corrected for telluric contamination. Indicated are the Hα emission line, the spectral range that has been used for the cross-correlation, and the absorption lines that could be unambiguously identified.
Current usage metrics show cumulative count of Article Views (full-text article views including HTML views, PDF and ePub downloads, according to the available data) and Abstracts Views on Vision4Press platform.
Data correspond to usage on the plateform after 2015. The current usage metrics is available 48-96 hours after online publication and is updated daily on week days.
Initial download of the metrics may take a while.