Fig. 23
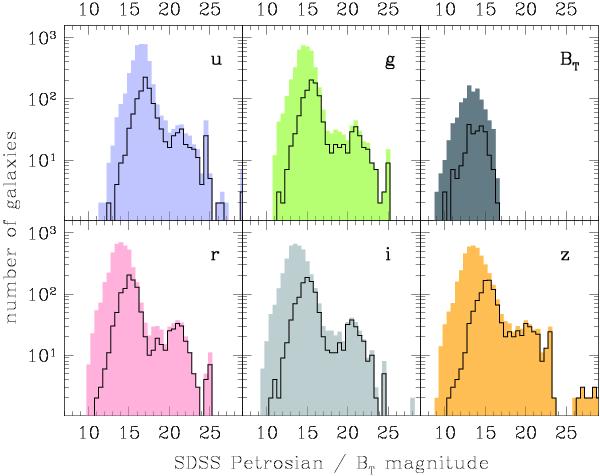
Shaded histograms show the distribution of SDSS Petrosian magnitudes for EFIGI galaxies in the u, g, r, i and z bands in intervals of 0.5 mag (2 upper left panels, and bottom panels), and the distribution of the PGC BT magnitude for the 1006 EFIGI galaxies for which it is available (upper right panel). In each panel, the black lines shows the histograms restricted to galaxies of types Sd and later. All panels for SDSS magnitudes show an extension to faint magnitudes (enhanced by the logarithmic scale), caused by the limitations in the processing of large objects by the SDSS photometric pipeline.
Current usage metrics show cumulative count of Article Views (full-text article views including HTML views, PDF and ePub downloads, according to the available data) and Abstracts Views on Vision4Press platform.
Data correspond to usage on the plateform after 2015. The current usage metrics is available 48-96 hours after online publication and is updated daily on week days.
Initial download of the metrics may take a while.