Fig. 8
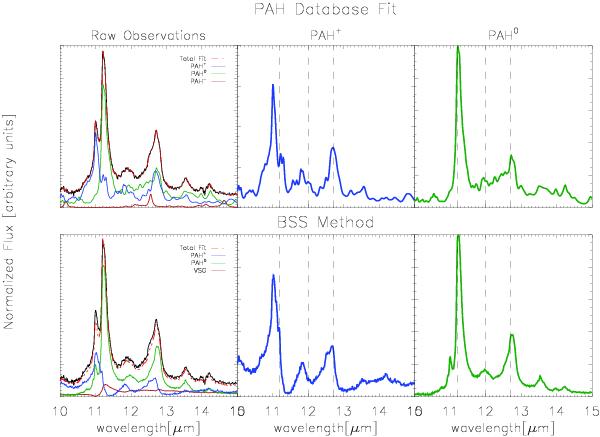
Comparison of the fitting results of the two methods, the NASA Ames PAH IR Spectroscopic Database (Bauschlicher et al. 2010) (top) and BSS (bottom). The left panel depicts an observed spectra which is fit with both the database and the BSS extracted spectra. The middle and right panels are the cation (middle) and neutral (right) components obtained from the respective methods. The signals are normalized to the 11.2 μm peak.
Current usage metrics show cumulative count of Article Views (full-text article views including HTML views, PDF and ePub downloads, according to the available data) and Abstracts Views on Vision4Press platform.
Data correspond to usage on the plateform after 2015. The current usage metrics is available 48-96 hours after online publication and is updated daily on week days.
Initial download of the metrics may take a while.