Fig. 7
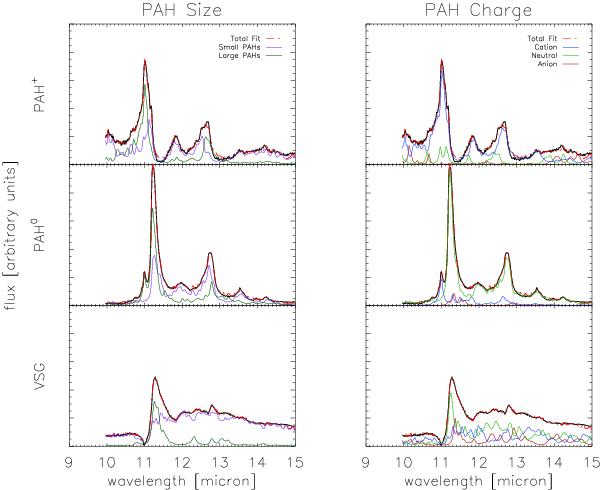
The fit from NASA Ames PAH IR Spectroscopic Database (Bauschlicher et al. 2010) of the three components extracted from BSS, PAH+ (top), PAH0 (middle), and VSG (bottom). In the left column, we compare large PAH contribution to small PAH contribution. In the right column we compare cation, neutral, and anion contribution to the fit.
Current usage metrics show cumulative count of Article Views (full-text article views including HTML views, PDF and ePub downloads, according to the available data) and Abstracts Views on Vision4Press platform.
Data correspond to usage on the plateform after 2015. The current usage metrics is available 48-96 hours after online publication and is updated daily on week days.
Initial download of the metrics may take a while.