Fig. 6
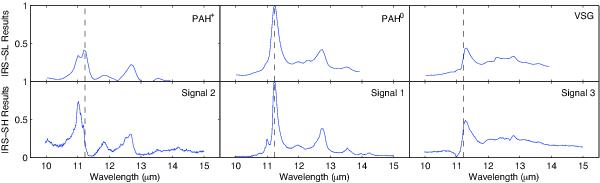
The top spectra are the results from Berné et al. (2010) using low-resolution IRS data, the bottom row of spectra are the current results, using high-resolution IRS. The vertical dashed black line indicates the 11.2 μm line position.
Current usage metrics show cumulative count of Article Views (full-text article views including HTML views, PDF and ePub downloads, according to the available data) and Abstracts Views on Vision4Press platform.
Data correspond to usage on the plateform after 2015. The current usage metrics is available 48-96 hours after online publication and is updated daily on week days.
Initial download of the metrics may take a while.