Fig. 4
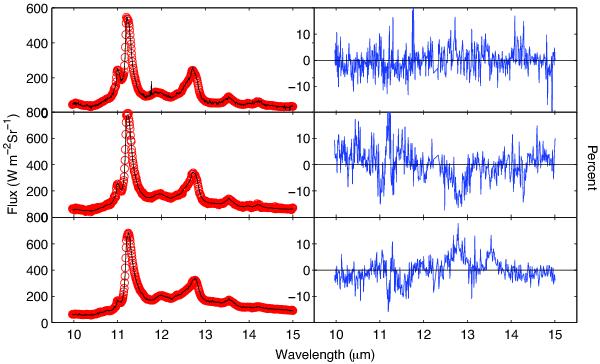
Spectra taken at three random spatial positions (left). The solid line represents the original observed spectra while the red overlapping circles (thick red line) represent a linear combination of the BSS extracted spectra. On the right is the matching residuals for each plot.
Current usage metrics show cumulative count of Article Views (full-text article views including HTML views, PDF and ePub downloads, according to the available data) and Abstracts Views on Vision4Press platform.
Data correspond to usage on the plateform after 2015. The current usage metrics is available 48-96 hours after online publication and is updated daily on week days.
Initial download of the metrics may take a while.