Fig. 3
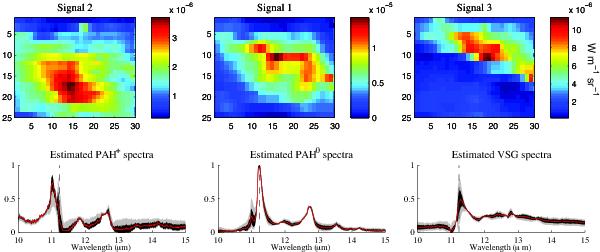
Bottom panels: extracted spectra using NMF, normalized at 11.2 μm. The vertical line represents the peak position of the estimated PAH0 spectra. The red line represents the average spectra out of 100 iterations. The grey envelope shows the minimum and maximum spectra and the black envelope shows the 1-σ error of the 100 iterations. Upper panels: spatial distributions of the weighting factors obtained by Least Squares Fitting of the observed spectra in the datacube using the BSS extracted spectra shown in red in the lower panel.
Current usage metrics show cumulative count of Article Views (full-text article views including HTML views, PDF and ePub downloads, according to the available data) and Abstracts Views on Vision4Press platform.
Data correspond to usage on the plateform after 2015. The current usage metrics is available 48-96 hours after online publication and is updated daily on week days.
Initial download of the metrics may take a while.