Fig. B.2
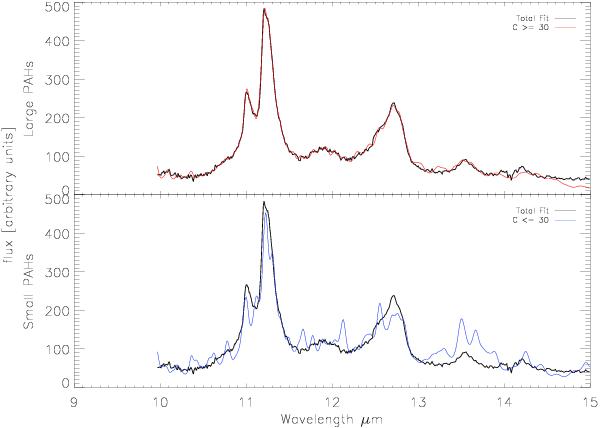
PAH Database fit results of fitting an observed spectrum limiting the species to large PAHs (C ≥ 30) (top) and small PAHs (C ≤ 30) (bottom). The black line represents the original observed spectrum, where the fit is represented in color.
Current usage metrics show cumulative count of Article Views (full-text article views including HTML views, PDF and ePub downloads, according to the available data) and Abstracts Views on Vision4Press platform.
Data correspond to usage on the plateform after 2015. The current usage metrics is available 48-96 hours after online publication and is updated daily on week days.
Initial download of the metrics may take a while.