Fig. 5
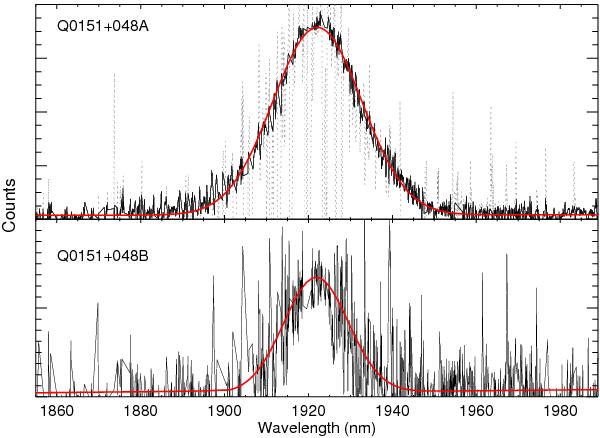
H α emission lines from Q 0151+048 A and B after subtraction of the QSOs continuum. As described in the text only the good data intervals between the strong airglow residuals were used. The data, including airglow residuals are shown as a light dotted line, the solid black line is data with the not used parts removed. The solid red lines show the best Gaussian profile fit to the used intervals. The inferred redshifts are zH α(A) = 1.9294 and zH α(B) = 1.9286.
Current usage metrics show cumulative count of Article Views (full-text article views including HTML views, PDF and ePub downloads, according to the available data) and Abstracts Views on Vision4Press platform.
Data correspond to usage on the plateform after 2015. The current usage metrics is available 48-96 hours after online publication and is updated daily on week days.
Initial download of the metrics may take a while.