Fig. 2
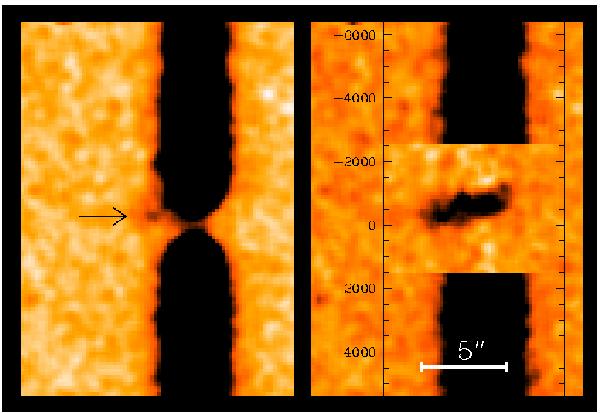
Left panel: NOT/ALFOSC 2D spectrum of qA, the dispersion is vertical with short wavelengths at the top. The DLA line is at the centre, the arrow points to faint extended Lyα emission.Right panel: same as left after SPSF subtraction. The full extent of the Lyα emission is now visible. It is seen to be tilted and shifted relative to the DLA. The vertical axis provides relative velocity (km s-1) in the rest frame of the DLA absorber.
Current usage metrics show cumulative count of Article Views (full-text article views including HTML views, PDF and ePub downloads, according to the available data) and Abstracts Views on Vision4Press platform.
Data correspond to usage on the plateform after 2015. The current usage metrics is available 48-96 hours after online publication and is updated daily on week days.
Initial download of the metrics may take a while.