Fig. 11
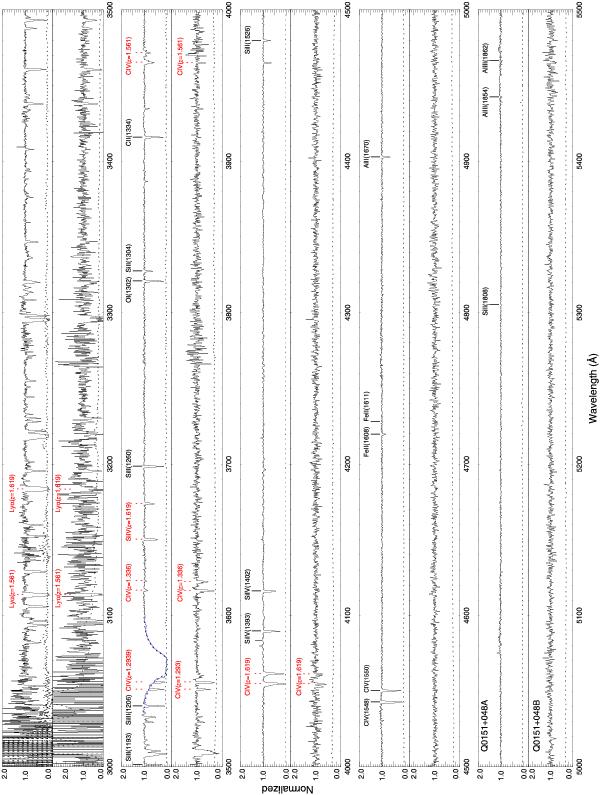
X-shooter UVB-arm spectra from 3000 − 5500 Å of qA in top panel and qB in bottom panel in each grid. Solid black lines with corresponding IDs in Q 0151+048A spectrum are from the DLA. The dashed blue line in Q 0151+048 spectrum shows the Voigt profile fit to the DLA with an inferred column density of log NH0 = 20.34 ± 0.02 for a redshift of 1.93421. Dashed red lines in both spectra are from the intervening absorbers with their corresponding IDs. The dotted line represents 1σ error on each spectra.
Current usage metrics show cumulative count of Article Views (full-text article views including HTML views, PDF and ePub downloads, according to the available data) and Abstracts Views on Vision4Press platform.
Data correspond to usage on the plateform after 2015. The current usage metrics is available 48-96 hours after online publication and is updated daily on week days.
Initial download of the metrics may take a while.