Fig. 1
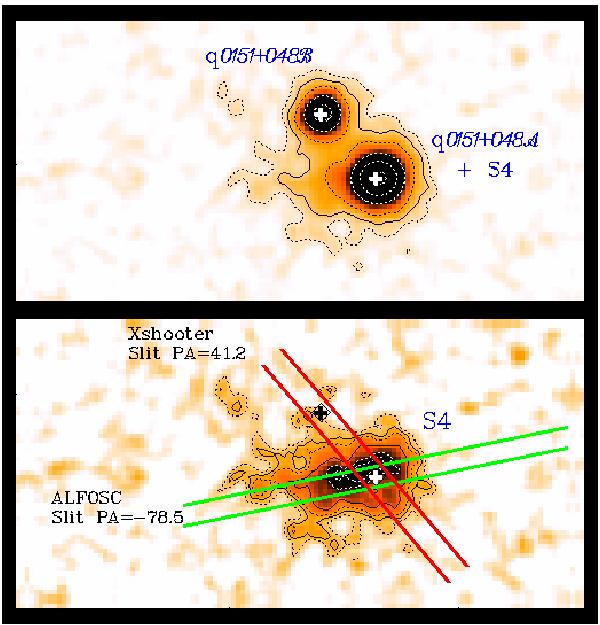
Top frame is a cut-out of the original narrow band image (FMW99). Contours are shown in black and the centres of the two QSOs are marked by a white cross. NE is to the upper left. In the bottom frame the QSOs were psf-subtracted and only the extended Lyα emission is seen. The crosses still mark the position of the QSOs. The slit-position along the Lyα major axis used for the NOT/ALFOSC observations is shown in green, the X-shooter A+B slit-position is shown in red.
Current usage metrics show cumulative count of Article Views (full-text article views including HTML views, PDF and ePub downloads, according to the available data) and Abstracts Views on Vision4Press platform.
Data correspond to usage on the plateform after 2015. The current usage metrics is available 48-96 hours after online publication and is updated daily on week days.
Initial download of the metrics may take a while.