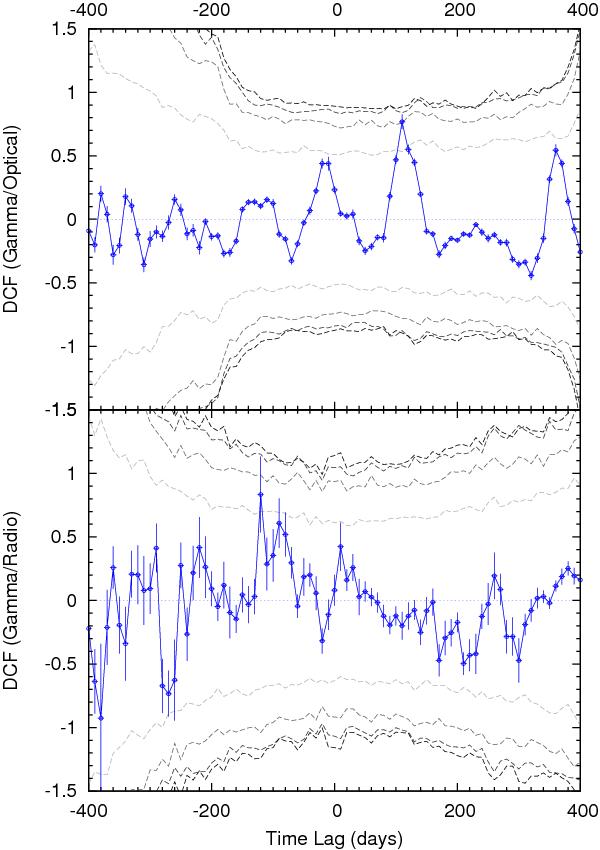
Fig. 5

Correlation between the five-day integrated γ-ray light curve and the optical (top) and radio (bottom) light curves of 3C 345. The correlation is obtained by calculating the discrete correlation function (DCF) with ten-day binning. A positive time-lag corresponds to the γ-ray variations preceding the variations in the other two bands. The significance of the correlation is illustrated by 3σ (99.7%) significance contours calculated from simulated, uncorrelated data with different slopes, β, of the power spectral density (PSD). The contours are drawn for the PSD slopes β = 1.0, 1.5, 2.0, and 2.5 (indicated by progression of colors, from light gray to black). For the simulated data, values of the correlation coefficient exceeding ± 1 are an inherent feature of the method, resulting from differences in overlap of the time series at different time lags (cf. Edelson & Krolik 1988; Timmer & Koenig 1995, and the description of the applied method in Sect. 3.4).
Current usage metrics show cumulative count of Article Views (full-text article views including HTML views, PDF and ePub downloads, according to the available data) and Abstracts Views on Vision4Press platform.
Data correspond to usage on the plateform after 2015. The current usage metrics is available 48-96 hours after online publication and is updated daily on week days.
Initial download of the metrics may take a while.


