Fig. 4
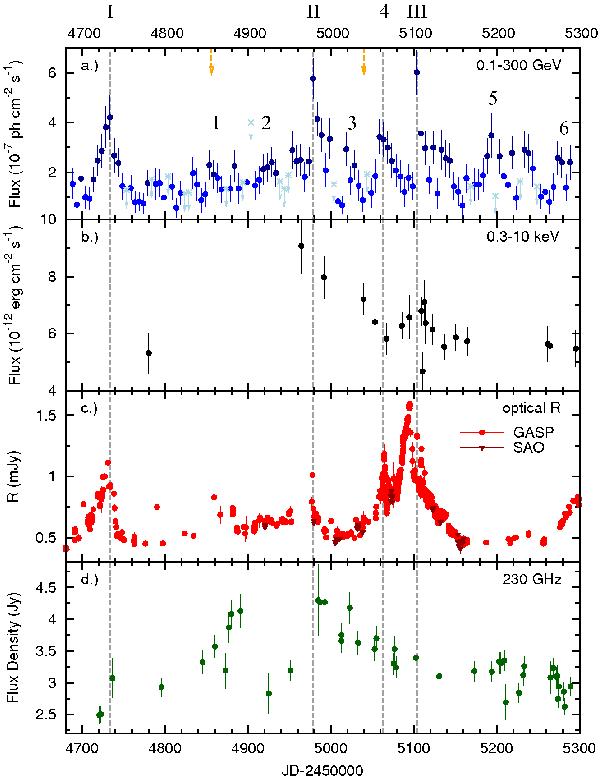
Multiwavelength light curves of 3C 345 for the 20-month period discussed in this paper, from top to bottom for: a) γ rays observed by Fermi-LAT between 0.1 and 300 GeV, values (filled circles) are five-day integrated, 2σ upper limits for five-day integrations are shown as light-blue crosses with downward arrows where TS < 5. Dark-blue filled circles have a TS > 25, the others are in the range 5 < TS ≤ 25. In contrast to Fig. 3, the γ-ray emission was fitted by a single power-law component placed at the position of 3C 345. b) X-rays observed by Swift XRT between 0.3 and 10 keV. c) Optical (R-band) observations performed by GASP and SAO. d) Millimeter radio observations by the SMA at 230 GHz. The two orange downward arrows on top indicate the observation epoch for which a new feature was detected in the pc-scale radio jet of 3C 345, see Sect. 3.4 and Schinzel et al. (2010). Three dominant flare events of high significance observed on two-day time scales were labeled with I − III. Several weaker events were identified and labeled with numbers from 1 − 6.
Current usage metrics show cumulative count of Article Views (full-text article views including HTML views, PDF and ePub downloads, according to the available data) and Abstracts Views on Vision4Press platform.
Data correspond to usage on the plateform after 2015. The current usage metrics is available 48-96 hours after online publication and is updated daily on week days.
Initial download of the metrics may take a while.