Fig. 3
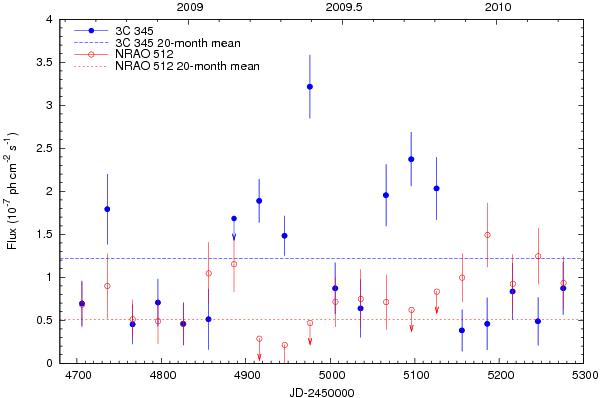
γ-ray light curves of 3C 345 and NRAO 512 for the first 20 months of Fermi-LAT monitoring, obtained through fitting two point-source model components with power-law spectra to the region of interest placed at the respective counterpart positions. Values were determined from integrating observations over 30 days within an energy range of 0.1 − 300 GeV. Blue filled circles are values obtained for 3C 345, red open circles are values for NRAO 512. Values with downward arrows represent 2σ upper limits shown in place of detections with low significance (TS < 5). The dashed lines plot the respective 20-month average γ-ray source flux. Errors are statistical only.
Current usage metrics show cumulative count of Article Views (full-text article views including HTML views, PDF and ePub downloads, according to the available data) and Abstracts Views on Vision4Press platform.
Data correspond to usage on the plateform after 2015. The current usage metrics is available 48-96 hours after online publication and is updated daily on week days.
Initial download of the metrics may take a while.