Fig. 7
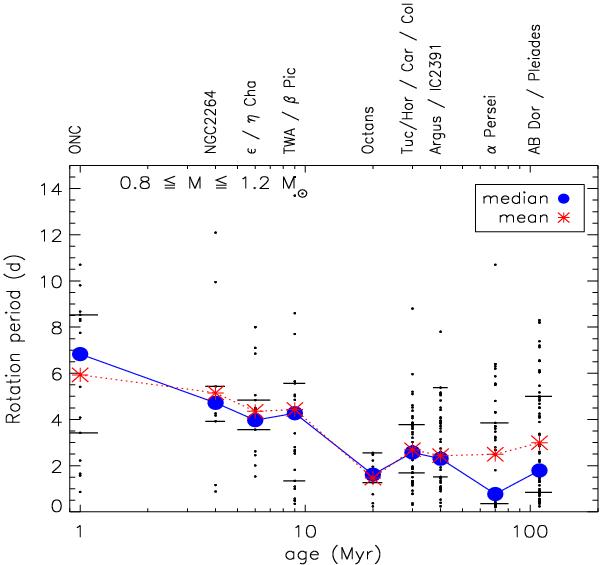
Rotation period evolution versus time in the 0.8–1.2 solar mass range. Small dots represent individual rotation period measurements. Bullets connected by solid lines are median periods, whereas asterisks connected by dotted lines are mean periods. Short horizontal lines represent the 25th and 75th percentiles of rotation period. This plot updates the right panel of Fig. 12 of Paper I.
Current usage metrics show cumulative count of Article Views (full-text article views including HTML views, PDF and ePub downloads, according to the available data) and Abstracts Views on Vision4Press platform.
Data correspond to usage on the plateform after 2015. The current usage metrics is available 48-96 hours after online publication and is updated daily on week days.
Initial download of the metrics may take a while.