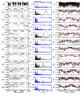
Fig. B.10
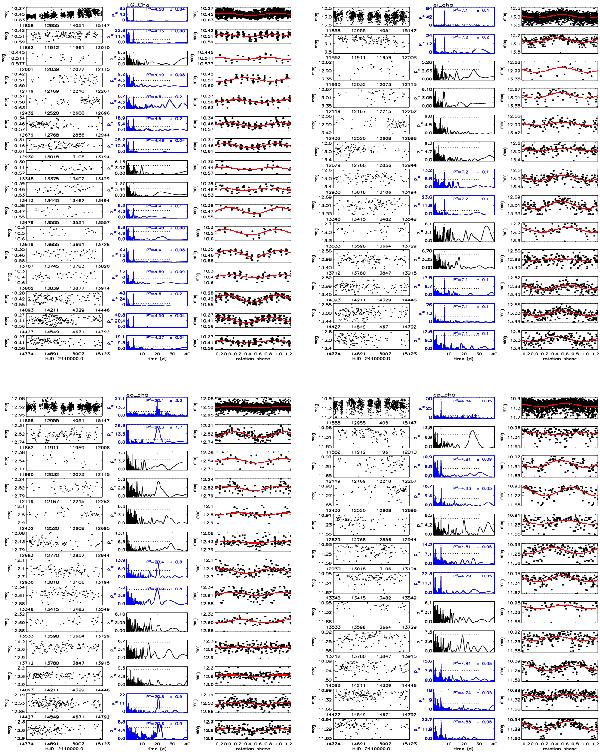
Photometry time series of η Chamaeleontis members: left columns display time segments of magnitudes versus HJD. Only the first panel shows the complete series. Middle columns display the Lomb-Scargle periodograms with the 99% confidence level indicated by an horizontal dashed line. Black panels indicate no period detection above the 99% confidence level. Right columns display the light curves phased with the rotation period and the first HJD as initial epoch. Solid lines represent the sinusoidal fit with the rotation period.
Current usage metrics show cumulative count of Article Views (full-text article views including HTML views, PDF and ePub downloads, according to the available data) and Abstracts Views on Vision4Press platform.
Data correspond to usage on the plateform after 2015. The current usage metrics is available 48-96 hours after online publication and is updated daily on week days.
Initial download of the metrics may take a while.