Free Access
Fig. 8
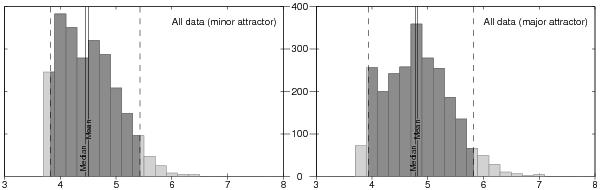
Distribution of 10 000 R0 realizations simulated using Monte-Carlo technique, their mean and median values, and the 90% error band. The window used for the running median procedure is w = 1 Mpc.
Current usage metrics show cumulative count of Article Views (full-text article views including HTML views, PDF and ePub downloads, according to the available data) and Abstracts Views on Vision4Press platform.
Data correspond to usage on the plateform after 2015. The current usage metrics is available 48-96 hours after online publication and is updated daily on week days.
Initial download of the metrics may take a while.