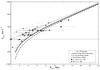
Fig. 6
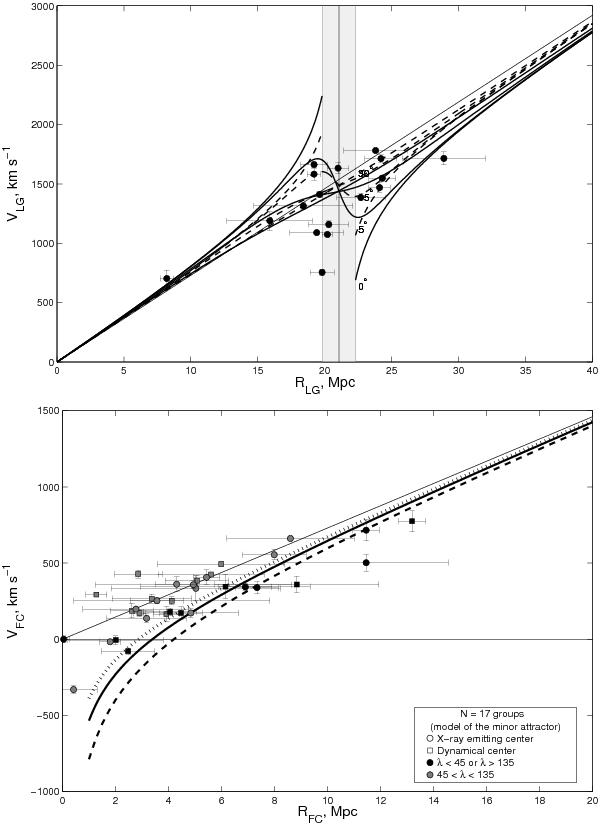
Top: radial velocities and distances of the groups relative to the Local Group centroid. The distance to the Fornax-Eridanus complex, 21.1 Mpc, corresponds to the spatial position of the dynamical center of all substructures forming the complex. The sets of dashed and dotted lines indicate the Hubble flow perturbed by a point-like mass of 2.16 × 10¹⁴ M⊙ and 0.87 × 10¹⁴ M⊙ respectively, signing different angular separations from the complex center (0°, 5°, 15°, and 30°). The error bars indicate rms uncertainties in distances and velocities. Bottom: the velocity vs. distance diagram relative to the center of the Fornax-Eridanus complex. Round and square markers correspond to the center of the hot X-ray emitting gas and the dynamical center of all substructures forming the complex, respectively. The dotted, solid and dashed lines correspond to the Hubble flow perturbed by a point-like mass of 0.53 × 10¹⁴ M⊙, 0.87 × 10¹⁴ M⊙, and 1.66 × 10¹⁴ M⊙, respectively.

Current usage metrics show cumulative count of Article Views (full-text article views including HTML views, PDF and ePub downloads, according to the available data) and Abstracts Views on Vision4Press platform.
Data correspond to usage on the plateform after 2015. The current usage metrics is available 48-96 hours after online publication and is updated daily on week days.
Initial download of the metrics may take a while.