Free Access
Fig. 4
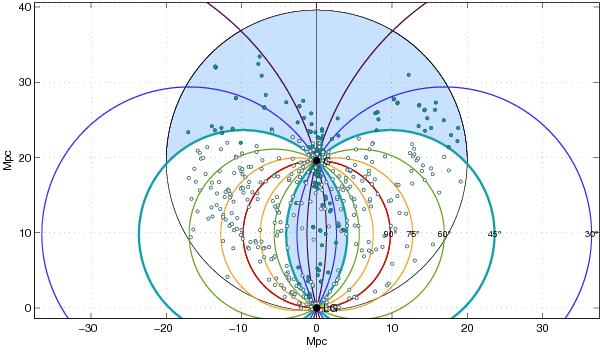
Spatial distribution of galaxies around the Fornax cluster. The zones where λ < 45° or λ > 135° are shaded blue whereas the exclusion zones are white. The same color code indicates if galaxies are included in the analysis. For clarity, lines of equal λ for values in the range 15°–90° are also shown.
Current usage metrics show cumulative count of Article Views (full-text article views including HTML views, PDF and ePub downloads, according to the available data) and Abstracts Views on Vision4Press platform.
Data correspond to usage on the plateform after 2015. The current usage metrics is available 48-96 hours after online publication and is updated daily on week days.
Initial download of the metrics may take a while.