Fig. 2
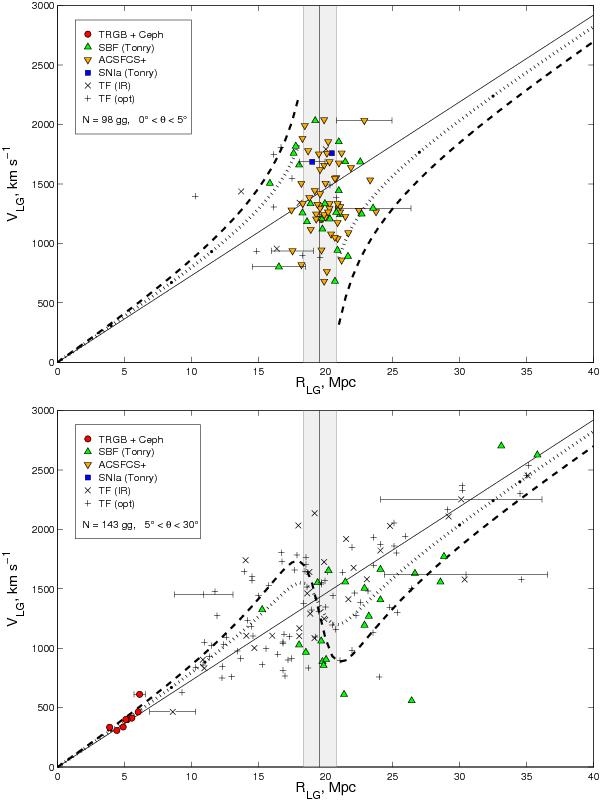
Radial velocity vs. distance relation for galaxies in the Fornax cluster region with respect to the Local Group centroid. Galaxy samples with distances derived by different methods are marked by different symbols. The inclined straight line traces Hubble relation with the global Hubble parameter H0 = 73 km s-1 Mpc-1. The virial zone is filled with gray. Two S-shaped lines correspond to a Hubble flow perturbed by masses of 1.30 × 10¹⁴ M⊙ (dotted) and 3.93 × 10¹⁴ M⊙ (dashed) as the limiting cases within the confidence range in the case of line-of-sight passing exactly through the cluster center. The typical distance error bars for each dataset are shown. Top: the cluster core within angular distance θ < 5°, the S-shaped lines indicate the expected infall at θ = 0°. Bottom: peripheric regions with 5° < θ < 30°, the S-shaped lines indicates the infall at θ = 5°.
Current usage metrics show cumulative count of Article Views (full-text article views including HTML views, PDF and ePub downloads, according to the available data) and Abstracts Views on Vision4Press platform.
Data correspond to usage on the plateform after 2015. The current usage metrics is available 48-96 hours after online publication and is updated daily on week days.
Initial download of the metrics may take a while.