Free Access
Fig. 4
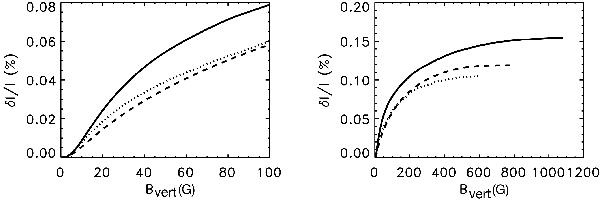
Cumulative brightness effect: excess contributed by all pixels with flux density less than B, as function of B. Solid: SST data, dashed: Hinode data. The dotted line shows the effect of reducing the SST data to the Hinode resolution and pixel scale. The left panel shows a zoom of the right panel.
Current usage metrics show cumulative count of Article Views (full-text article views including HTML views, PDF and ePub downloads, according to the available data) and Abstracts Views on Vision4Press platform.
Data correspond to usage on the plateform after 2015. The current usage metrics is available 48-96 hours after online publication and is updated daily on week days.
Initial download of the metrics may take a while.