Fig. 2
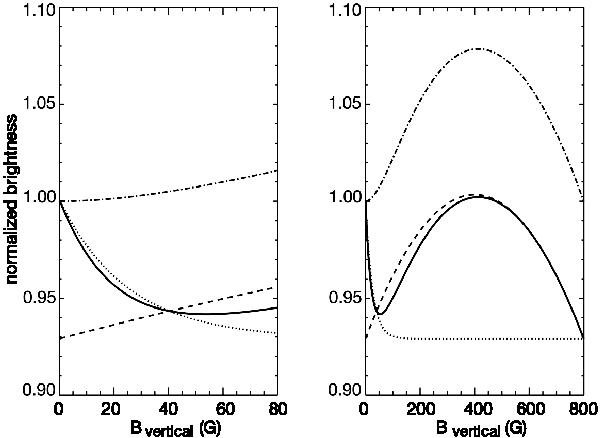
Effect of the different ingredients of the model (shown on expanded horizontal scale in the left panel). Solid: model fit of the brightness as function of observed flux density B (the dotted line in Fig. 3, Hinode data). Dotted: same if the bright strong field component is omitted from the model. Dashed: same if the weak field component is omitted. Dot-dashed: predicted magnetic brightness if the preference for intergranular lanes were absent.
Current usage metrics show cumulative count of Article Views (full-text article views including HTML views, PDF and ePub downloads, according to the available data) and Abstracts Views on Vision4Press platform.
Data correspond to usage on the plateform after 2015. The current usage metrics is available 48-96 hours after online publication and is updated daily on week days.
Initial download of the metrics may take a while.