Free Access
Fig. 1
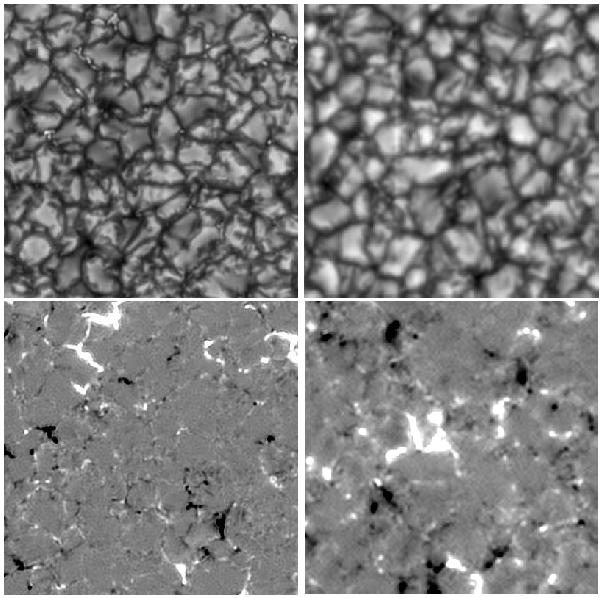
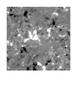
Quiet regions at disk center as seen in continuum around 630.5 nm (top) and in magnetic flux density (bottom), showing 20″ × 20″ subfields of the SST (left) and Hinode (right) observations used. Flux density range is from -100 (black) to 100 G (white).
This figure is made of several images, please see below:
Current usage metrics show cumulative count of Article Views (full-text article views including HTML views, PDF and ePub downloads, according to the available data) and Abstracts Views on Vision4Press platform.
Data correspond to usage on the plateform after 2015. The current usage metrics is available 48-96 hours after online publication and is updated daily on week days.
Initial download of the metrics may take a while.