Fig. 9
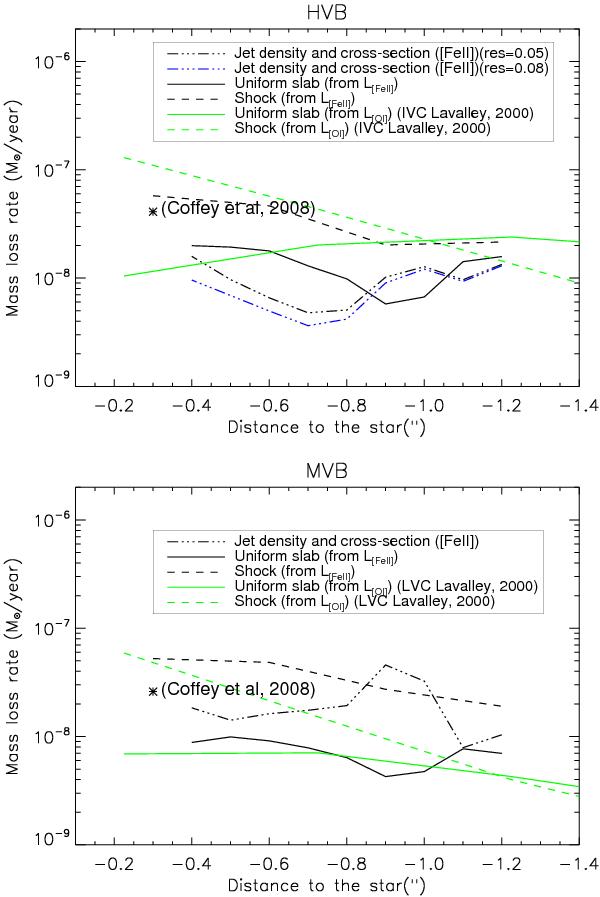
Values of the mass-loss rate for the atomic blueshifted jet as a function of projected distance to the star and for the two velocity components: HVB (top panel) and MVB (bottom panel). The values derived from the [Fe ii] 1.64 μm observations using the three methods discussed in the text are plotted with black curves: jet density and cross-section (dashed-dotted curve), uniform slab (full curve), shock front (dashed curve). The values obtained by Lavalley-Fouquet et al. (2000) using the optical line [O i] and methods 2 and 3 are shown for comparison (gray/green curves). Star symbols show the values obtained by Coffey et al. (2008) from an optical HST/STIS transverse slit at –0 3.
3.
Current usage metrics show cumulative count of Article Views (full-text article views including HTML views, PDF and ePub downloads, according to the available data) and Abstracts Views on Vision4Press platform.
Data correspond to usage on the plateform after 2015. The current usage metrics is available 48-96 hours after online publication and is updated daily on week days.
Initial download of the metrics may take a while.