Fig. 8
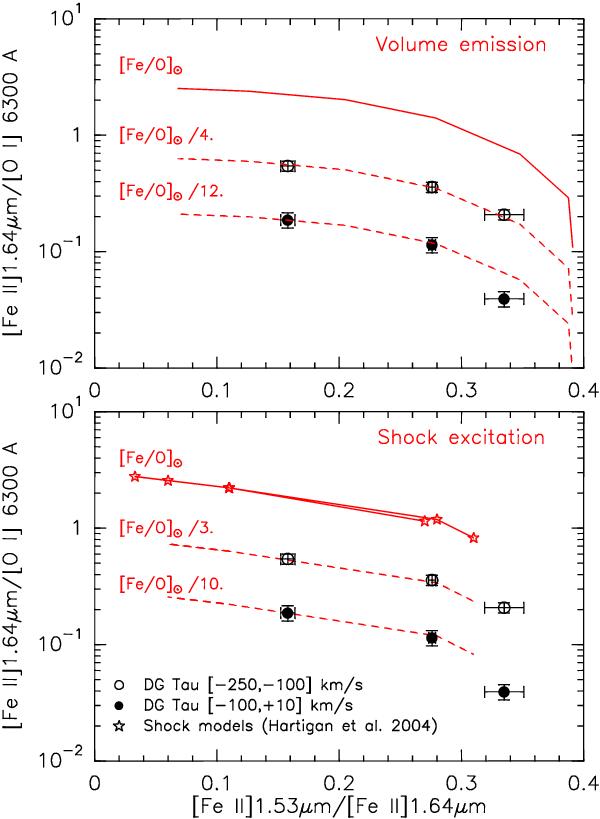
Line ratio diagnostic diagram for Fe gas phase depletion: [Fe ii] 1.64 μm/[O i] 6300 Å versus [Fe ii] 1.53/1.64 μm. [Fe ii] line fluxes are integrated over the same velocity and spatial intervals as [O i] fluxes from Lavalley-Fouquet et al. (2000). The three data points correspond to distances along the DG Tauri blueshifted jet of 0 25, 075 and 125 (increasing with decreasing [Fe ii] 1.53/1.64 μm). Full curves show predictions for volume emission at 8000 K (top panel) and for J-shocks (bottom panel) from Hartigan et al. (2004b) assuming an [Fe/O] solar gas phase abundance of 0.062 (Asplund et al. 2005). Dashed curves show [Fe/O] abundances required to reproduce observed line ratios. They indicate Fe gas phase depletion by a factor 3−4 for the IVB[–250, –100] km s-1 and 10−12 for the LVB[–100, +10] km s-1 intervals.
Current usage metrics show cumulative count of Article Views (full-text article views including HTML views, PDF and ePub downloads, according to the available data) and Abstracts Views on Vision4Press platform.
Data correspond to usage on the plateform after 2015. The current usage metrics is available 48-96 hours after online publication and is updated daily on week days.
Initial download of the metrics may take a while.