Fig. 5
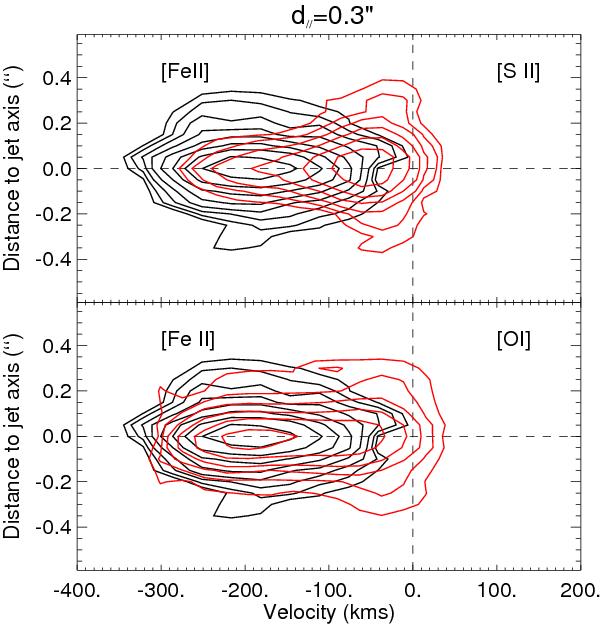
Comparison of transverse PV diagrams of [S ii]6731 Å and [O i]6300 Å (red curves) obtained in 2003 with HST/STIS at  from the source in a 0
 1 wide slit (Coffey et al. 2007, 2008) with a transverse PV diagram in [Fe ii] (black curves) at the exact same position, reconstructed from our SINFONI datacube obtained in October 2005. Note the striking lack of [Fe ii] emission in the spatially wide low-velocity [O i] component at V = −30, − 40 km s-1.
Current usage metrics show cumulative count of Article Views (full-text article views including HTML views, PDF and ePub downloads, according to the available data) and Abstracts Views on Vision4Press platform.
Data correspond to usage on the plateform after 2015. The current usage metrics is available 48-96 hours after online publication and is updated daily on week days.
Initial download of the metrics may take a while.