Fig. 4
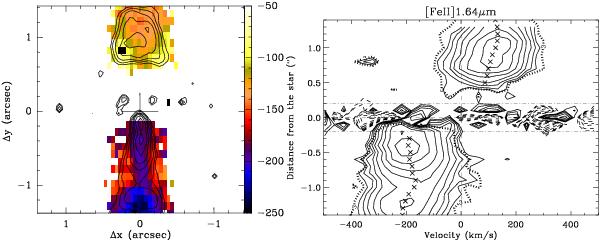
Left: 2D maps of the [Fe ii] 1.64 μm velocity centroid deduced from one component Gaussian fitting of the line profile. Redshifted velocities are shown on a negative scale to better highlight the velocity asymmetry between them. Spectra with SNR lower than 5 were masked. The cross marks the location of the continuum. Contours show the sum of the deconvolved HV and MV channel maps. Right: PV diagram of [Fe ii] along the jet, averaged over  across the jet, with velocity centroids indicated as crosses. Horizontal dash-dotted lines indicate the region where residual noise after continuum subtraction is still large. Contours start at 2.43 × 10⁻¹⁵ W m-2 μm-1 arcsec-2 and increase by factors of
  . The 3σ contour is shown as a dotted line.
Current usage metrics show cumulative count of Article Views (full-text article views including HTML views, PDF and ePub downloads, according to the available data) and Abstracts Views on Vision4Press platform.
Data correspond to usage on the plateform after 2015. The current usage metrics is available 48-96 hours after online publication and is updated daily on week days.
Initial download of the metrics may take a while.