Fig. 2
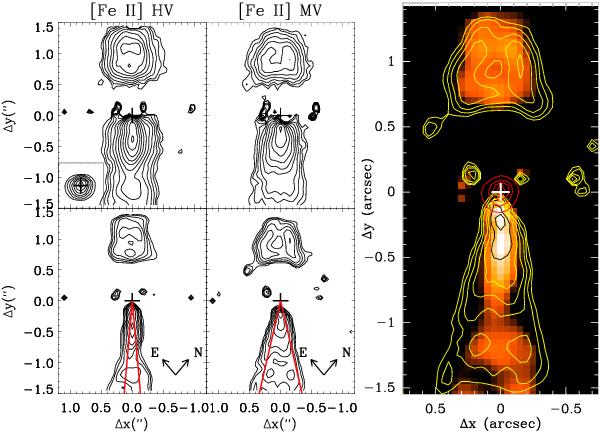
Left: continuum-subtracted [Fe ii] 1.64 μm channel maps of the DG Tau jet before (top panels) and after (bottom panels) deconvolution by the continuum image. The HV channel maps are integrated over the velocity intervals [–300, –160] km s-1 (HVB) and [+120,+260] km s-1 (HVR); the MV channel map over [–160, –50] km s-1 (MVB) and [–50, +120] km s-1 (MVR). The blueshifted lobe is at Δy < 0. The pixel scale is 0 05. A cross denotes the centroid of the continuum emission (shown as an insert in the top left panel). Contours start at 3σ and increase by factors of
  (lowest contours are 2.0 and 1.8 × 10⁻¹⁸ W m-2 arcsec-2 in the raw HV and MV maps respectively). The solid red lines in the deconvolved maps show the opening angle measured in each component. Right: superposition of the deconvolved HV (background color image) and MV (yellow contours) channel maps. The stellar continuum is shown in red contours. The white cross locates the continuum centroid.
Current usage metrics show cumulative count of Article Views (full-text article views including HTML views, PDF and ePub downloads, according to the available data) and Abstracts Views on Vision4Press platform.
Data correspond to usage on the plateform after 2015. The current usage metrics is available 48-96 hours after online publication and is updated daily on week days.
Initial download of the metrics may take a while.