Fig. 1
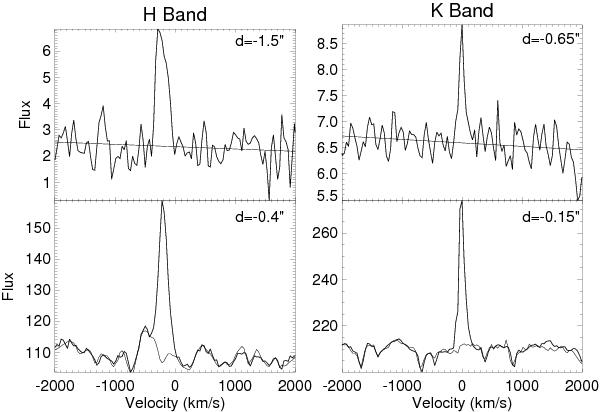
Illustration of the continuum substraction methods, close to the star (bottom row) and far from the star (top row), for the [Fe ii] 1.64 μm (left panels) and the H2 2.12 μm line (right panels). The raw spectra are plotted in thick lines and the fitted continua in thin lines. See text for details. The analysis and discussion of H2 2.12 μm lines will be presented in a separate paper.
Current usage metrics show cumulative count of Article Views (full-text article views including HTML views, PDF and ePub downloads, according to the available data) and Abstracts Views on Vision4Press platform.
Data correspond to usage on the plateform after 2015. The current usage metrics is available 48-96 hours after online publication and is updated daily on week days.
Initial download of the metrics may take a while.