Fig. 6
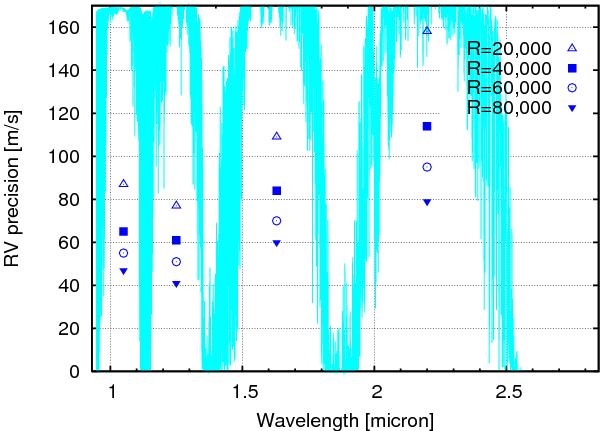
Same as Fig. 5, but for Case B, where we masked out regions of heavy telluric contamination (i.e. 3% or more of telluric absorption at R = 80 000) in our analysis. The gray spectrum in the background represents the transmission of the Earth’s atmosphere (the value 170 in the y-axis corresponds to 100% transmission). The highest radial velocity precision is attained in the J band.
Current usage metrics show cumulative count of Article Views (full-text article views including HTML views, PDF and ePub downloads, according to the available data) and Abstracts Views on Vision4Press platform.
Data correspond to usage on the plateform after 2015. The current usage metrics is available 48-96 hours after online publication and is updated daily on week days.
Initial download of the metrics may take a while.