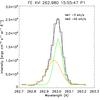
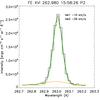
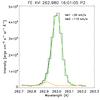
Fig. 8
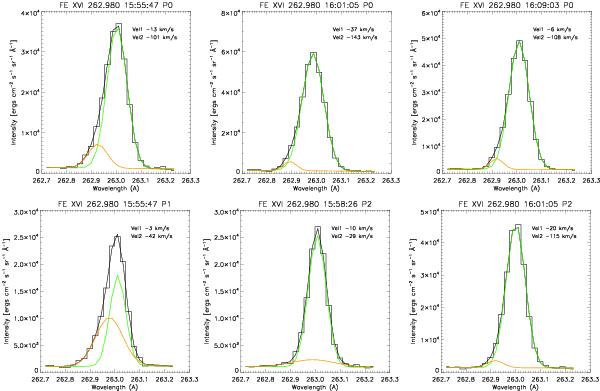
Fe xvi double component fits at positions shown in Fig. 9. The two Gaussian components of the fit are marked in green and orange, the total fit by the solid black line, and the data by the stepped black line. Velocities of both components (Vel1: green, Vel2: orange) are derived from a common reference wavelength for each raster. Plots on the top row show the evolution of the enhanced blue wing component at Position 0 during the impulsive phase of the flare. In the other two positions, shown on the bottom row, the enhancement is only prevalent early on in Position 1 and only just noticeable at Position 2.
Current usage metrics show cumulative count of Article Views (full-text article views including HTML views, PDF and ePub downloads, according to the available data) and Abstracts Views on Vision4Press platform.
Data correspond to usage on the plateform after 2015. The current usage metrics is available 48-96 hours after online publication and is updated daily on week days.
Initial download of the metrics may take a while.