Fig. 7
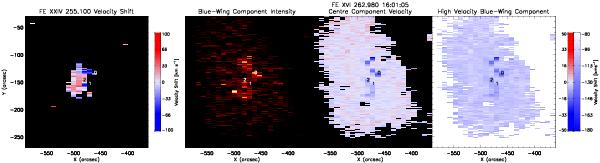
A high temperature line analysis for Fe xxiv (left hand image) and Fe xvi (right hand images). Fe xxvi velocity shifts derived from a single Gaussian fit are are shown in the left hand image while images from a double Gaussian fit of Fe xvi are shown on the right. From left to right: the intensity of the second Gaussian component, the velocity shift of the centre component and velocity shift of the second component found in the blue-wing – note the corresponding velocity ranges for each image. The positions marked are identical to those shown in Fig. 9 and Sect. 4.3.
Current usage metrics show cumulative count of Article Views (full-text article views including HTML views, PDF and ePub downloads, according to the available data) and Abstracts Views on Vision4Press platform.
Data correspond to usage on the plateform after 2015. The current usage metrics is available 48-96 hours after online publication and is updated daily on week days.
Initial download of the metrics may take a while.