Fig. 4
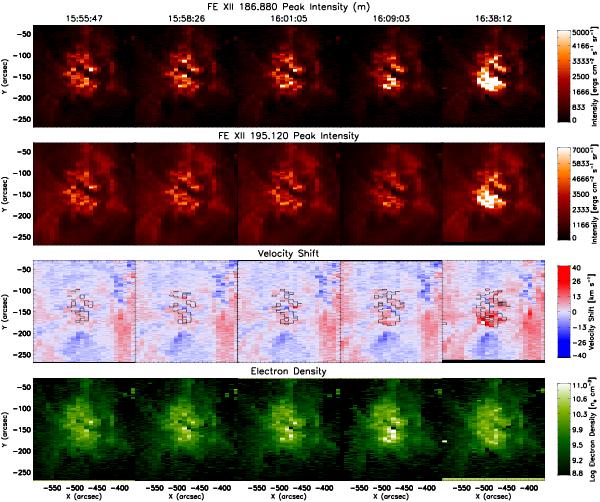
Fitted rasters for Fe xii. The top and second row show the intensities in each of the lines used in forming the diagnostic, with the upper one being produced by excitation from the metastable (density sensitive) level. Velocity maps are produced using the 195.120 Å line and overlaid with density contours at log ne = 10.2. The first four columns correspond to the impulsive phase, with the fourth column at the observed peak.
Current usage metrics show cumulative count of Article Views (full-text article views including HTML views, PDF and ePub downloads, according to the available data) and Abstracts Views on Vision4Press platform.
Data correspond to usage on the plateform after 2015. The current usage metrics is available 48-96 hours after online publication and is updated daily on week days.
Initial download of the metrics may take a while.