Fig. 2
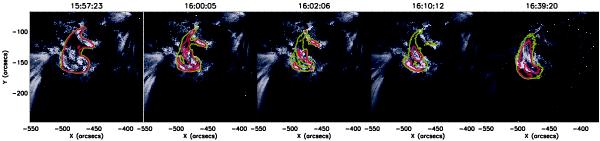
The flare seen by TRACE at 171 Å over several stages during its evolution. Over plotted are Hinode/XRT contours shown in green and magenta, marking 60% and 80% intensity levels. The overall XRT intensity in each image peaks around the time of the 16:10 frame, however the maximum extent of the loop structure shown does not vary greatly.
Current usage metrics show cumulative count of Article Views (full-text article views including HTML views, PDF and ePub downloads, according to the available data) and Abstracts Views on Vision4Press platform.
Data correspond to usage on the plateform after 2015. The current usage metrics is available 48-96 hours after online publication and is updated daily on week days.
Initial download of the metrics may take a while.