Fig. 10
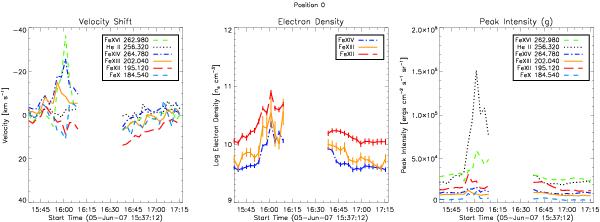
Time evolution of plasma parameters in the bright region labelled “0” in Fig. 9. From left to right, the panels show the line-of-sight velocity shift in five ionisation stages of iron plus one helium, the density variations, and the intensity including the components of the density diagnostic excited from the ground state. Velocities for Fe xvi are derived from the centre component of the double fits in Sect. 4.2.
Current usage metrics show cumulative count of Article Views (full-text article views including HTML views, PDF and ePub downloads, according to the available data) and Abstracts Views on Vision4Press platform.
Data correspond to usage on the plateform after 2015. The current usage metrics is available 48-96 hours after online publication and is updated daily on week days.
Initial download of the metrics may take a while.