Fig. 1
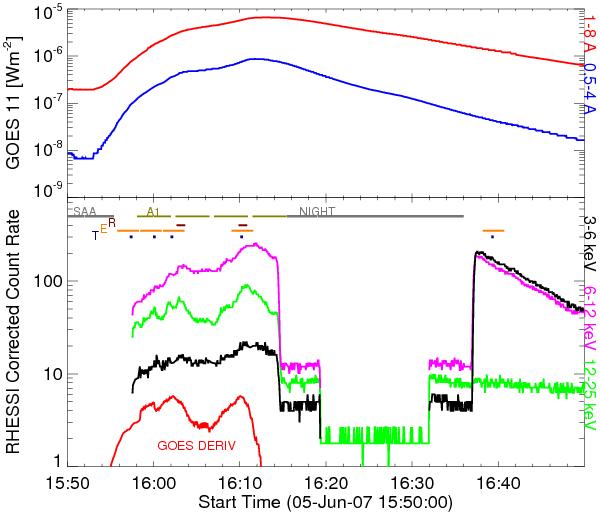
GOES (top panel) and RHESSI (bottom panel) X-ray light curves of the flare. In the bottom panel the times of the EIS raster, TRACE images and RHESSI images/spectra are shown by the labeled bars. A time derivative of the GOES 1−8 Å channel is found in red and has been scaled for context purposes. Also shown are the times of RHESSI South Atlantic Anomaly (SAA) passage and Eclipse period, when no data is available, and when the attenuating shutters were deployed (A1).
Current usage metrics show cumulative count of Article Views (full-text article views including HTML views, PDF and ePub downloads, according to the available data) and Abstracts Views on Vision4Press platform.
Data correspond to usage on the plateform after 2015. The current usage metrics is available 48-96 hours after online publication and is updated daily on week days.
Initial download of the metrics may take a while.