Fig. 7
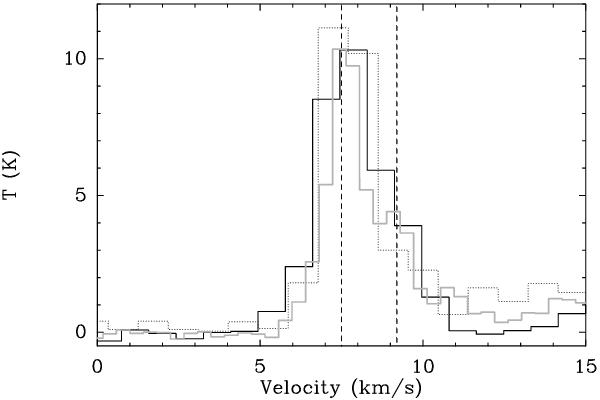
Two HCOOCH3 components observed on the emission peak MF1 toward the Compact Ridge. The black spectrum shows the 223 465.340 MHz line, the gray spectrum the 225 855.505 MHz transition and the dotted line spectrum the 203 435.554 MHz transition. The intensity of these 2 spectra is multiplied by a factor 1.5 and 2, respectively. Dashed lines mark vLSR = 7.5 and 9.2 km s-1.
Current usage metrics show cumulative count of Article Views (full-text article views including HTML views, PDF and ePub downloads, according to the available data) and Abstracts Views on Vision4Press platform.
Data correspond to usage on the plateform after 2015. The current usage metrics is available 48-96 hours after online publication and is updated daily on week days.
Initial download of the metrics may take a while.