Fig. 20
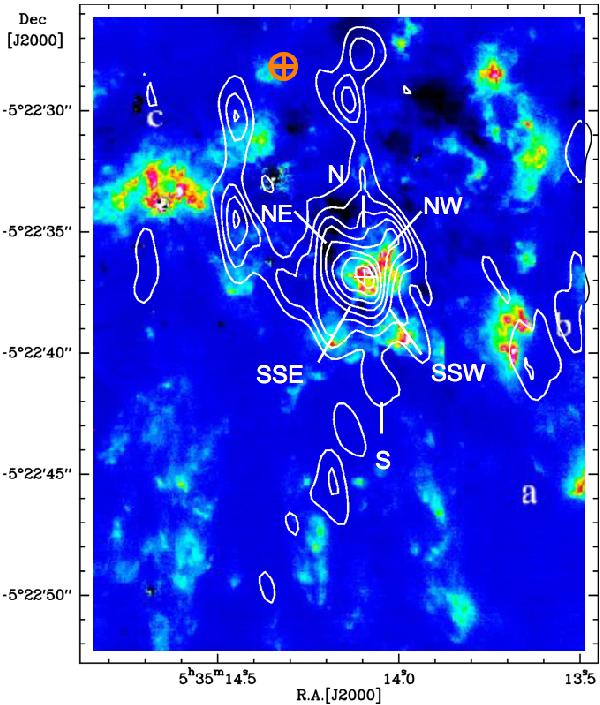
Methyl formate 8.7 km s-1 channel map contours overlaid over Lacombe et al. (2004) 2.12 μm excited H2 emission showing a good correlation of both tracers toward MF1 (white cross) and around (northwest (NW), south-southwest (SSW) and south-southeast (SSE)). The northeast (NE) region analysis is hampered by the subtraction of strong 2 μm continuum from IRc4 (see Fig. 17) – which results in an artefact (the zone in black). The red circled cross marks the proper motion center where the sources n, I, and BN were located 500 years ago (Gómez et al. 2005, 2008; Rodríguez et al. 2005).
Current usage metrics show cumulative count of Article Views (full-text article views including HTML views, PDF and ePub downloads, according to the available data) and Abstracts Views on Vision4Press platform.
Data correspond to usage on the plateform after 2015. The current usage metrics is available 48-96 hours after online publication and is updated daily on week days.
Initial download of the metrics may take a while.