Free Access
Fig. 16
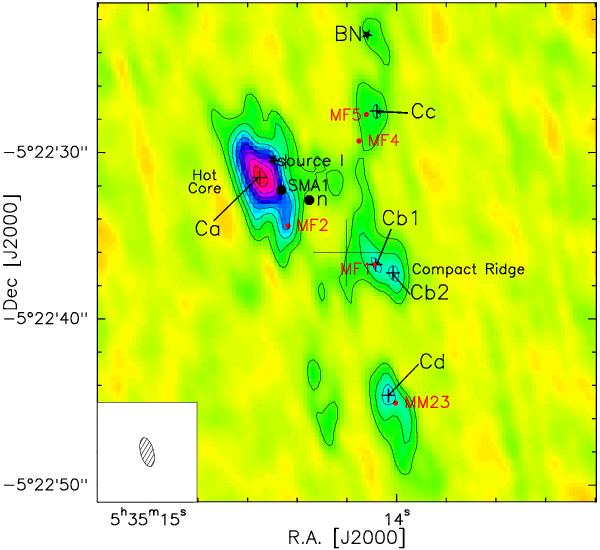
Continuum emission map obtained with the IRAM Plateau de Bure Interferometer at 223.67 GHz. The level step is 60 mJy beam-1 (3.5σ) for a beam size of 1.8″ × 0.8″. Dark crosses label the 4 different continuum components, while points label the main molecular HCOOCH3 emission peaks.
Current usage metrics show cumulative count of Article Views (full-text article views including HTML views, PDF and ePub downloads, according to the available data) and Abstracts Views on Vision4Press platform.
Data correspond to usage on the plateform after 2015. The current usage metrics is available 48-96 hours after online publication and is updated daily on week days.
Initial download of the metrics may take a while.