Free Access
Fig. 15
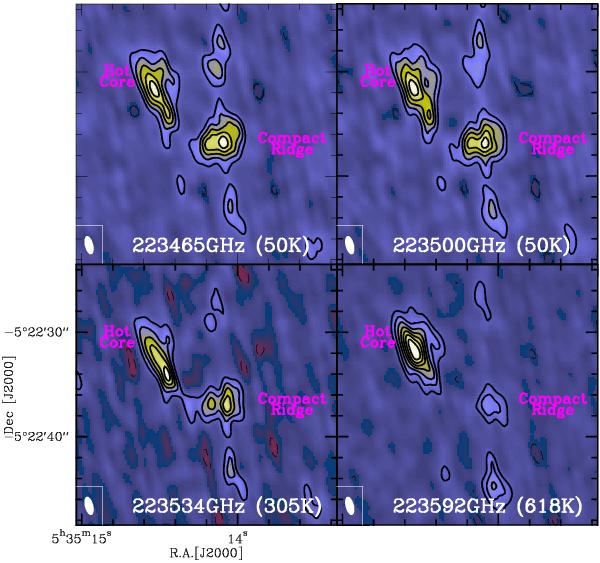
HCOOCH3 intensity maps integrated in velocity between 6 and 9 km s-1. The line frequency and the upper state energy are indicated on each plot. The methyl formate emission is stronger towards MF1 than MF2 for low upper energy transitions, while the opposite is verified for high upper state energies.
Current usage metrics show cumulative count of Article Views (full-text article views including HTML views, PDF and ePub downloads, according to the available data) and Abstracts Views on Vision4Press platform.
Data correspond to usage on the plateform after 2015. The current usage metrics is available 48-96 hours after online publication and is updated daily on week days.
Initial download of the metrics may take a while.