Fig. 10
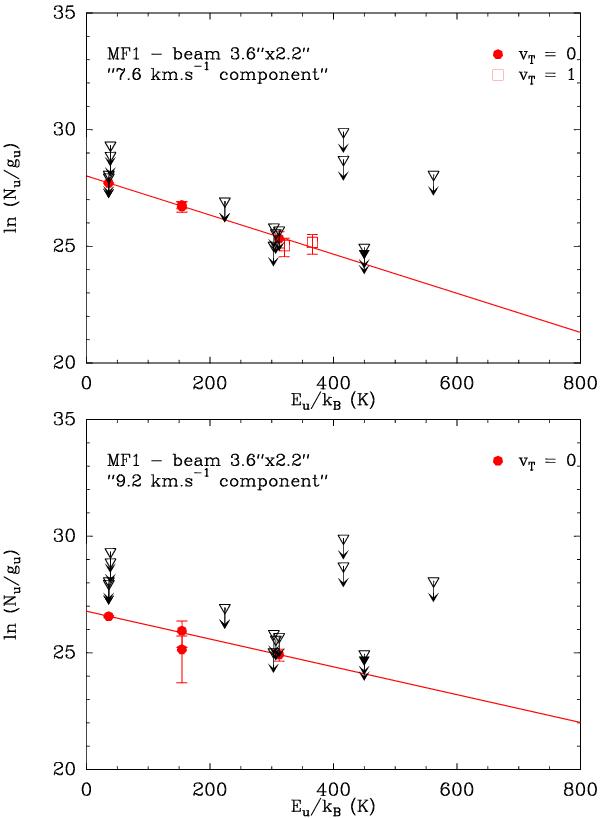
Rotational diagram of the first (top) and the second (bottom) components toward the MF1 peak, based only on data observed with a synthesized beam of 3.63″ × 2.26″. Dots and squares with error bars mark detected and partially blended lines in the fundamental and first excited states vt = 0 and vt = 1, respectively, and filled triangles mark undetected lines and open triangles blended lines. The red line is the fit according to the method described in Sect. 4. The derived temperature is 119 ± 10 K and 168 ± 30 K, respectively.
Current usage metrics show cumulative count of Article Views (full-text article views including HTML views, PDF and ePub downloads, according to the available data) and Abstracts Views on Vision4Press platform.
Data correspond to usage on the plateform after 2015. The current usage metrics is available 48-96 hours after online publication and is updated daily on week days.
Initial download of the metrics may take a while.