Fig. 6
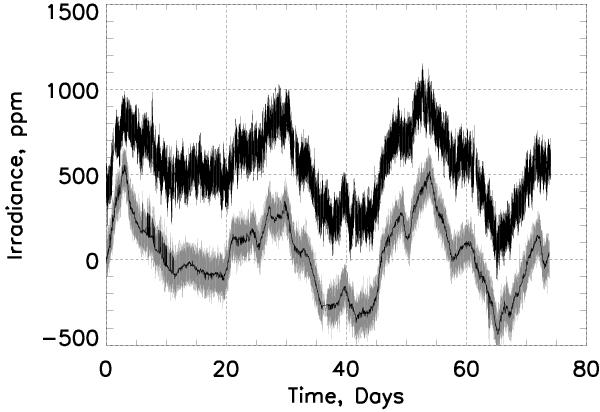
Total solar irradiance observed by VIRGO between March and May 1999 (upper black curve) and reconstructed using MDI data (lower black curve). Also plotted (in gray) is the combination of magnetic reconstruction with granulation model. The sampling rate of the VIRGO data is 1 min, while the magnetic reconstruction alone is sampled each 30 min. The magnetic reconstruction and the combined reconstruction plus granulation model are shifted down by 500 ppm to facilitate the visual comparison.
Current usage metrics show cumulative count of Article Views (full-text article views including HTML views, PDF and ePub downloads, according to the available data) and Abstracts Views on Vision4Press platform.
Data correspond to usage on the plateform after 2015. The current usage metrics is available 48-96 hours after online publication and is updated daily on week days.
Initial download of the metrics may take a while.