Fig. 4
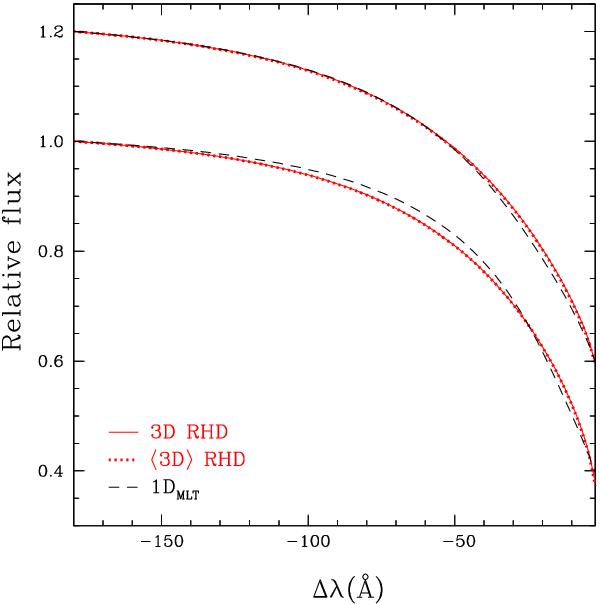
Comparison of Hβ line profiles calculated with Linfor3D for the 3D (solid lines, averaged over 12 selected snapshots) and 1DMLT (dashed lines) models in the case of two non-gray simulations at Teff of 11 300 K and 12 390 K (the latter shifted by 0.2 units of flux for clarity). The dotted lines (indistinguishable from the 3D spectra in the figure) also show the ⟨ 3D ⟩ profiles resulting from spatial and temporal averages of the 3D structures.
Current usage metrics show cumulative count of Article Views (full-text article views including HTML views, PDF and ePub downloads, according to the available data) and Abstracts Views on Vision4Press platform.
Data correspond to usage on the plateform after 2015. The current usage metrics is available 48-96 hours after online publication and is updated daily on week days.
Initial download of the metrics may take a while.