Fig. 5
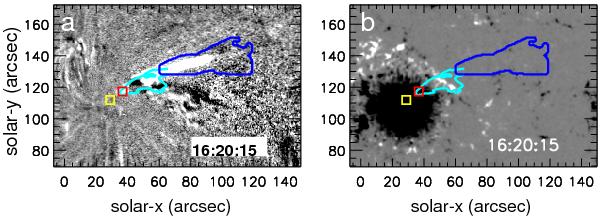
a) Base difference 211 Å image. b) Line-of-sight magnetic field scaled between ± 250 G. The yellow rectangles mark the position used for the sunspot intensity oscillation, the red rectangles mark the jet footpoint position, the blue contour outlines the jet region and the light blue the position of the low-lying loops. These regions are used for the cross correlation shown in Fig. 6.
Current usage metrics show cumulative count of Article Views (full-text article views including HTML views, PDF and ePub downloads, according to the available data) and Abstracts Views on Vision4Press platform.
Data correspond to usage on the plateform after 2015. The current usage metrics is available 48-96 hours after online publication and is updated daily on week days.
Initial download of the metrics may take a while.